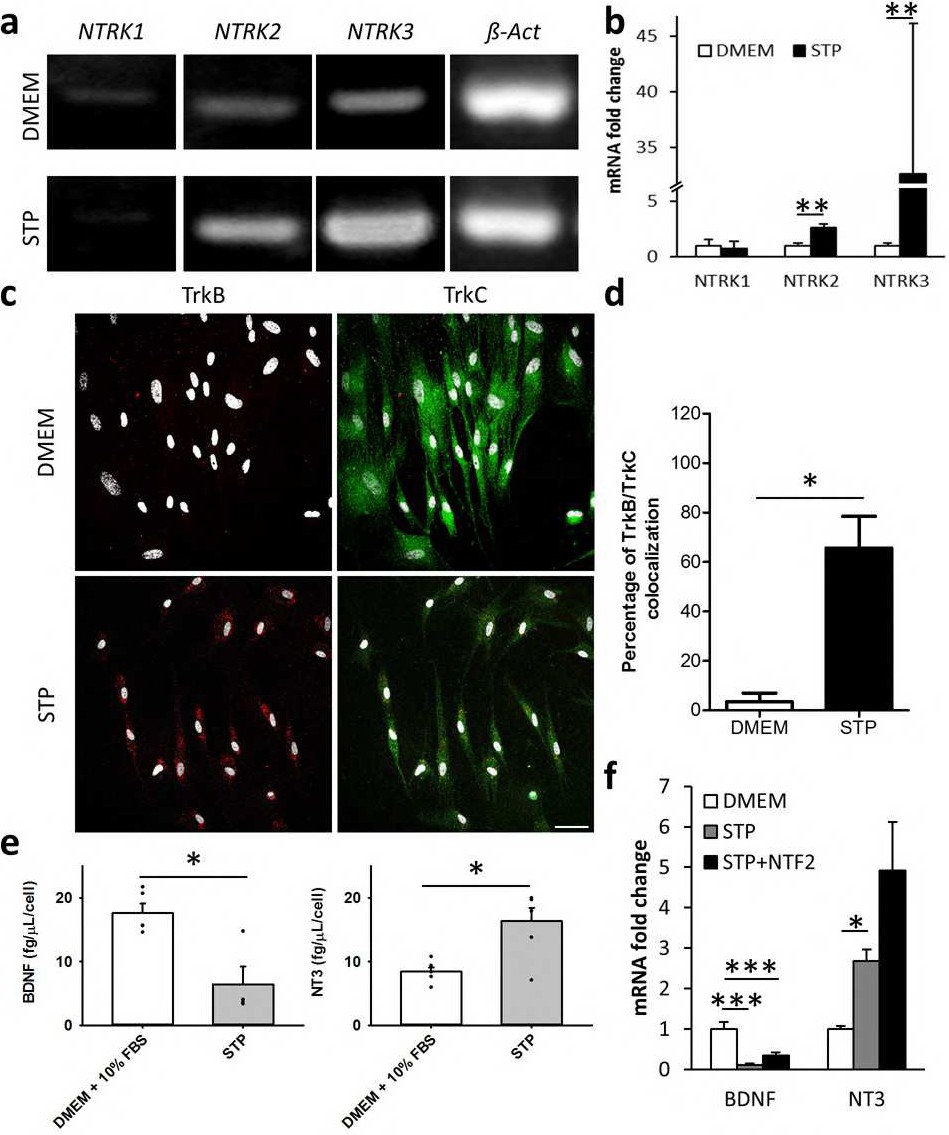
Fig. 3. Expression of Neurotrophin ligands and receptors in hDPSCs grown in DMEM+10% FBS and STP media: a) hDPSC grown in DMEM+10% FBS and STP express neurotrophin receptors, as assessed by conventional RT-PCR. b) Changes in the expression levels of neurotrophin receptor coding genes NTRK1, NTRK2 and NTRK3 as assessed by Q-PCR. Significantly higher levels of expression were found in NTRK2 and NTRK3 for STP-grown hDPSCs. Mann Whitney ** = p<0.01. c) Expression levels of TrkB and TrkC in hDPSCs for 7 days in DMEM or STP culture media. d) Quantification of percentage of cells colocalizing both TrkB ansd TrkC receptors. Scale bar 50µm. e) hDPSCs cultured using STP media significantly reduced the release of BDNF (left) and increased the release of NT-3 (right). Data were analyzed by Mann-Withney *=p<0.05. Experiments were performed in triplicate. f) Changes in the expression levels of neurotrophin ligands in DMEM+10% FBS, STP and STP/NTF2 conditions by Q-PCR. Significantly higher levels of expression were found for NT-3 on both STP and STP/NTF2 media. Statistics were analyzed by ANOVA following by Scheffe post-hoc analysis. *=p<0.05, *** =p<0.001. Experiments were performed in triplicate.